
In April we announced a PRO version of our IP sensors. Five months later the firmware is
feature-complete and has been running on bench hardware for weeks, so here is an honest
status: what is built, what drifted from the original plan, and what is still ahead.
Still standalone, still LAN-only
The core promise has not changed. PRO runs entirely on your network: no cloud, no account,
no app. It is Ethernet only (no Wi‑Fi, no Bluetooth, by design), works on an isolated network
with no internet access, and a built-in real-time clock keeps the time across a power cut, so
history and alerts keep working without NTP.
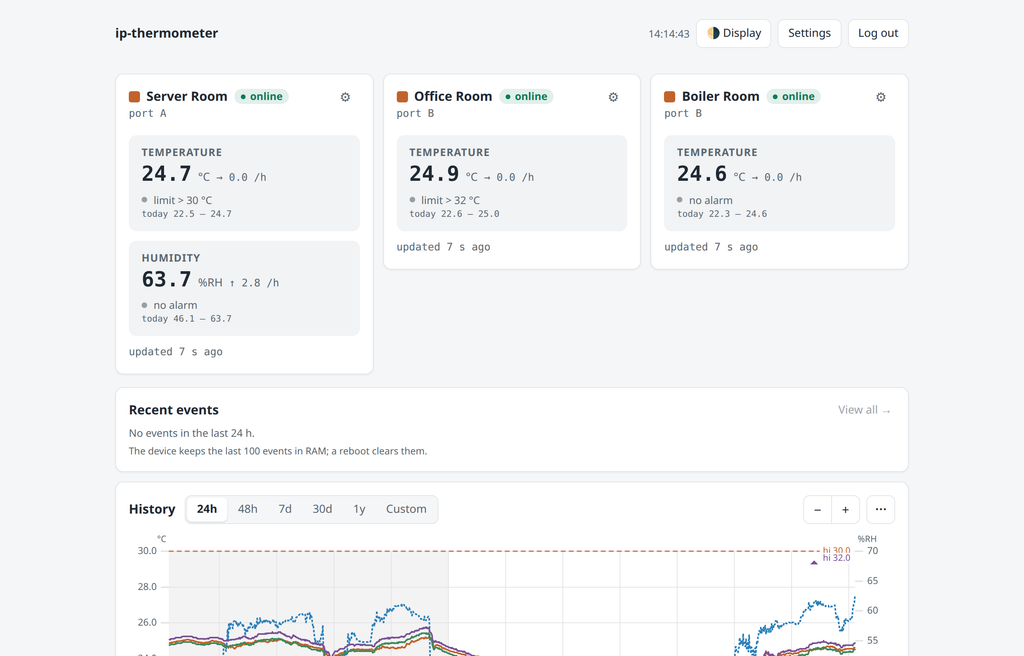
The live dashboard. Each reading shows its trend over the last hour, today’s minimum and
maximum, and the alarm limit that applies to it.
What PRO does today
- Two universal probe ports. DS18B20 temperature probes (including several on one cable)
and SHT30 temperature + humidity probes, hot-pluggable, up to 8 readings per device. Probes
are recognised automatically and keep their name and settings when swapped. - A full year of history in the device. One-minute resolution for the last two days and
hourly minimum/average/maximum for a year, stored in the device’s own flash. It survives a
power cut and a firmware update. The chart zooms from a year down to the hour, and down to the minute for the last two
days; any window exports to CSV. - Alarms that behave. High and low limits per reading, hysteresis, a hold time so a short
blip does not alert, optional reminders while an alarm stands, and separate “sensor lost”
and “sensor faulty” events. The alarm log survives a reboot. - Email alerts and scheduled reports. SMTP with TLS, including private mail servers with
your own CA and plain relays on an isolated LAN. Daily, weekly or interval reading reports
to email or a webhook. - Integrations. MQTT with Home Assistant auto-discovery, SNMP v2c and v3 with traps and
our own registered MIB, and webhooks (GET or POST, templated body). - Operations. JSON HTTP API, HTTPS with your own certificate, firmware update from the
browser with automatic rollback if the new image does not come up, settings export and
import, °C/°F, time zone by name, light and dark themes, and a phone-friendly layout.
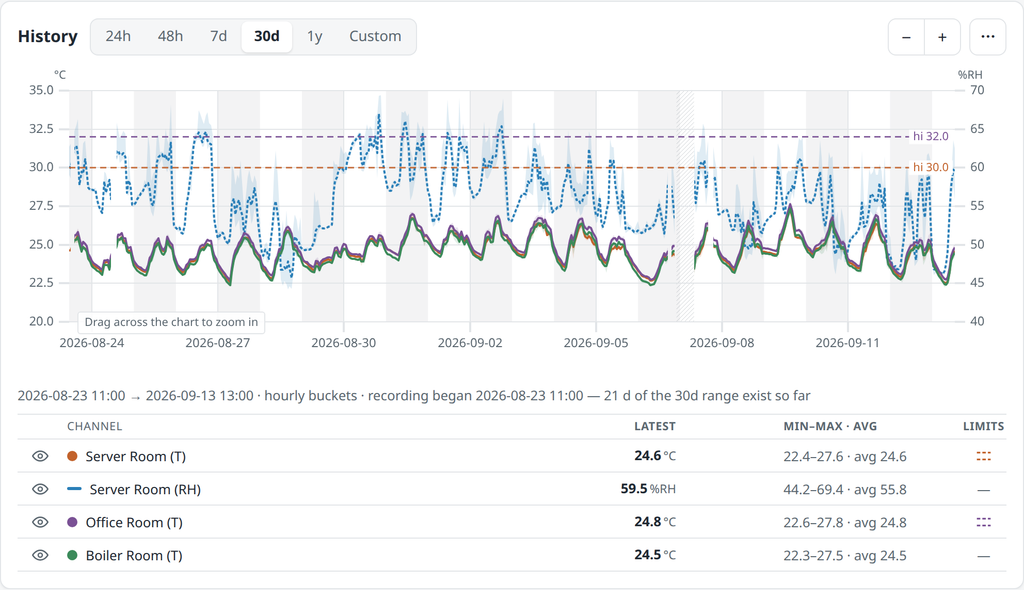
Three weeks of real data from a bench unit: hourly averages with the min–max band, alarm
limits drawn on the chart, and a per-channel summary underneath.
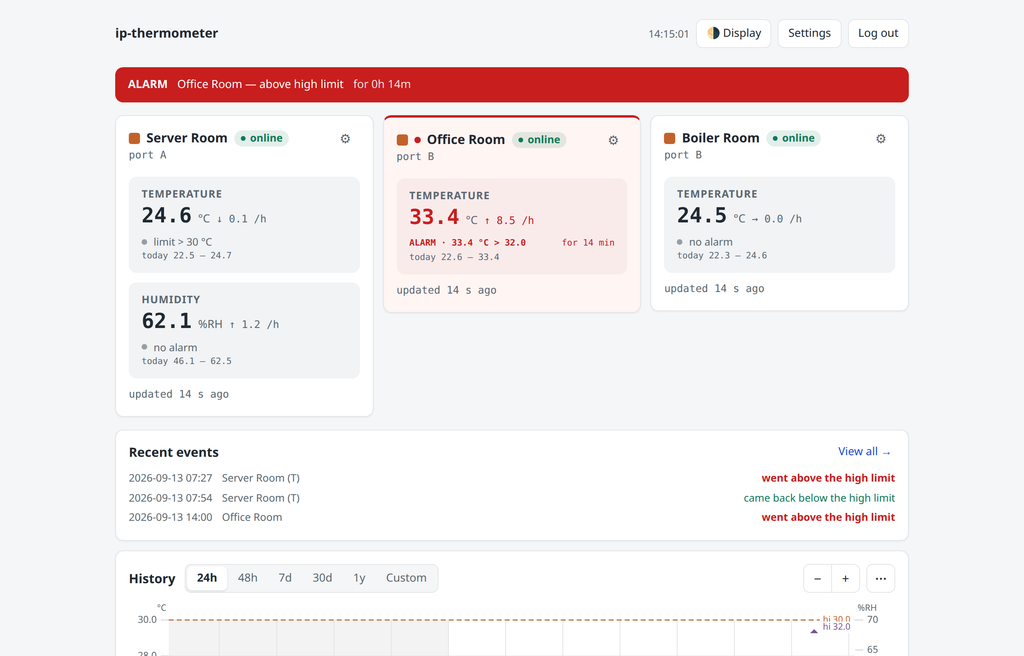
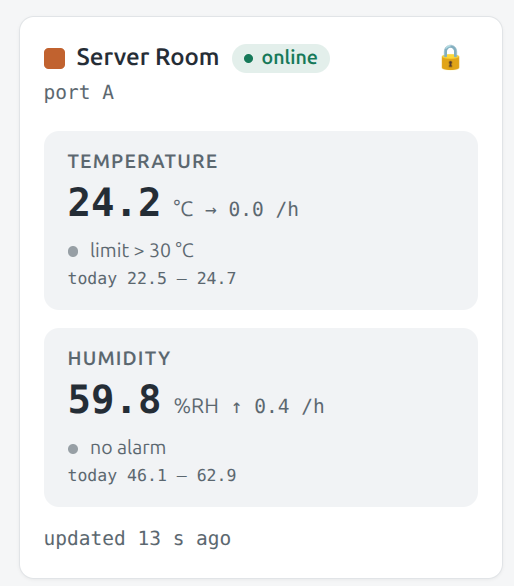
An alarm as it appears: the reading, the limit it crossed, how long it has stood, and the
recent events list.
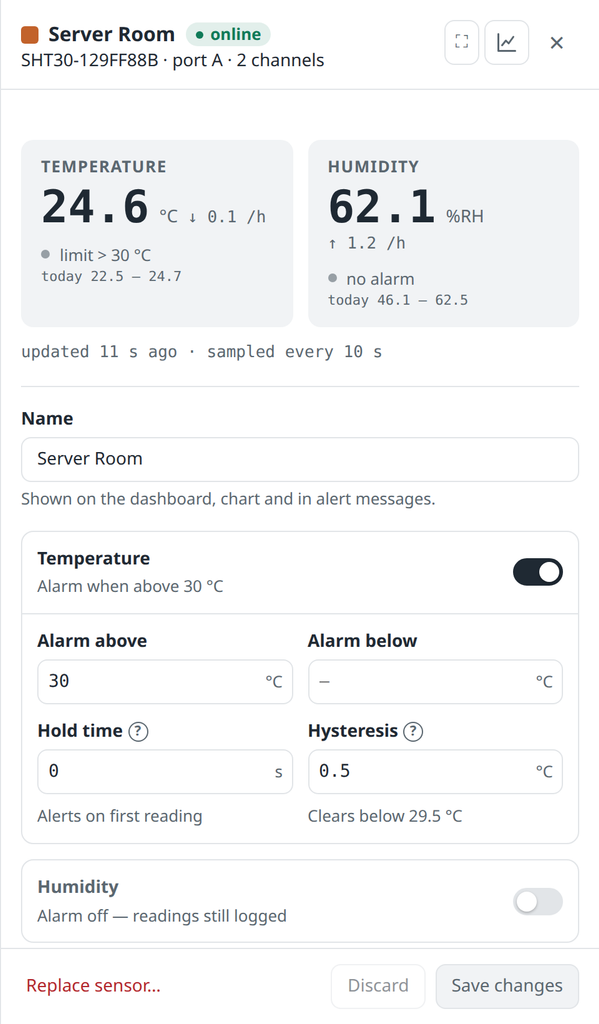
Per-probe settings: a name, and an alarm per reading with limits, hold time and
hysteresis.
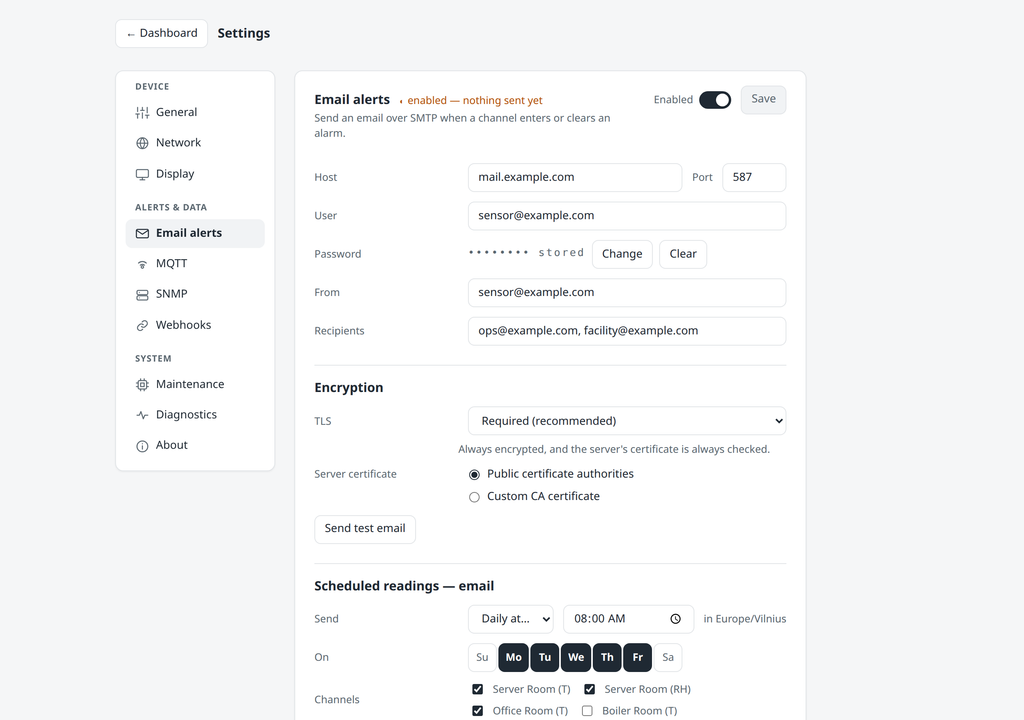
Email alerts with a scheduled readings report.
What changed since April
Not everything went as first announced, so for the record:
- Modbus TCP is not in the first release. It was on the April list. A Modbus register
map is a permanent contract, and we want to define it with the integrators who will
actually use it rather than guess. HTTP, MQTT and SNMP are all in. - “One year or more” of history is exactly one year. Hourly data for 12 months and
one-minute data for the last two days, sized for the device’s flash. Anything longer belongs
in the system you export to. - Up to 8 readings per device. Two ports, DS18B20 chains allowed, eight channels total.
For more, use more devices; every one of them looks the same to MQTT, SNMP or the API.
What is next
The firmware side is in a hardening phase: two whole-project reviews, an on-device test suite
that runs against real mail servers, brokers and SNMP managers, and bench units logging
around the clock. The open work is physical: PRO runs on a reference board today, and the
production board, probe connectors, surge protection and enclosure are what stand between
this and the first units.
Feature requests are still very welcome. If there is something you need PRO to do, tell us
before the hardware is final.